Written August 2025
ADB {parameters} {switches}
ADB, the A-Shell DeBugger, provides a means to interactively debug compiled programs, including dynamically setting breakpoints, single stepping, querying variables, etc..
Parameters
prog.ext
Optional name and extension of program to debug. This is typically a RUN file, it could be an SBX or LIT.
Switches
/LSX{DIR}=directory
Specifies the directory (DevPPN or ersatz notation) where LSX files matching the program(s) to be debugged can be found.
/TARGET{JOB}=jobnam
If specified, identifies an existing target job where the code to be debugged is running, or will be run. If not specified, a slave job (named ADB### where ### is the current job #) will be launched. Under Windows, the slave job will appear on the toolbar and can be made visible in the normal way. Under UNIX, it runs in background and remains invisible.
Operation
On startup, ADB performs the following steps:
| • | Unless the /TARGETJOB switch is specified, a slave process is launched and logged in to the same directory that ADB is running from. |
| • | If prog.ext is specified, the corresponding LSX file is loaded from the directory specified by the /LSX switch. If not specified or the file isn't found, you will be prompted for an alternate location. Note that for full functionality, the LSX file should be created using the /SYM switch to add the symbol table. |
| • | A listening socket is opened for the target job to connect to. |
| • | An inter-job communication (IJC) command is sent to the target job informing it of our listening socket and asking it to connect back to us to permit debugging. |
| • | ADB then waits for the target job to respond. This may take a few seconds and requires that the target job be running at least A-Shell version 7.0.1778. |
| • | Once communication is established, ADB goes into interactive mode |
In interactive mode, ADB displays a prompt ("ADB >") and waits for and processes a variety of keyboard commands. While waiting, it may receive messages from the remote job, displaying them spontaneously. Initially, it will looking something like this:
ADB version 1.0(106) A-Shell DeBugger
Launching task ADB1 ...
Message sent to ADB1 on job 2 (JACKX1:2B)
Waiting for ACK .... [ACK]
Waiting for target to connect [^C to abort] ...
Connection Accepted!
Cmd/Rep: INIT/ACK Status: MON TIW / Running
Msg: Init Debugging
Debugging
ADB >
Use HELP {command} to display the list of available commands, or details on a specific command. See the following walkthroughs to get a better sense of how to use them.
Comments
ADB borrows liberally from aspects of the GNU command line debugger gdb, including naming convention, command structure, etc. Obviously that is only helpful to those already familiar with it in the Linux environment. However, unlike gdb and most other debuggers, ADB does not rely on symbols (source code and variable information) being embedded in the target program via a special debug compilation. Instead, it relies on local access to the external symbol files (LSX) created by COMPIL /LF /SYM to navigate the object code being debugged. That may seem like a difference without a distinction since in both cases special compiler features need to be employed, but the advantage of the ADB approach is that the symbol files, although needing to be stored and accessible to ADB, are not part of and do not have any effect on the RUN code. This eliminates (a) potential issues arising from differences between the debug-mode and release-mode code, and (b) the hassle of having to toggle between debug and release versions of the object code.
A second significant difference, at least compared to the command line text mode implementation of gdb is that ADB operates in a separate foreground process from the process being debugged, eliminating complications that otherwise arise when both the debugger and the target process being debugged share the same display. Although this typically requires that you have two sessions (two windows or two ATE connections) open and accessible at your workstation, it offers several advantages, including:
| • | The ability to debug a process that you can’t see and don’t otherwise have physical control over or access to, provided that it is connected to the same server and hasn’t blocked TCP connections or signals. |
| • | The ability to initiate debugging on a target that is already mid-program. This is potentially useful for debugging processes that have gotten stuck in an unknown state that you don’t know how to reproduce. |
| • | The ability to terminate debugging and detach from the target process, allowing it to continue unaffected by the operation. This assumes use of the /TARGETJOB switch to debug an existing process; otherwise the target process launched by ADB is shut down automatically when ADB exits. |
| • | Elimination of all display conflicts between the two processes. In fact, the target can include multiple GUI windows even though ADB itself runs in text mode. |
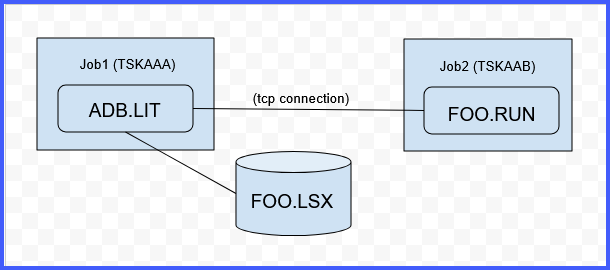
Here’s a simple schematic of how the pieces fit together:
The following "walkthrough" topics provide extended examples of ADB in action:
See Also
| • | COMPIL switches /LF and /SYM |
History
2025 August, A-Shell 7.0.1778: ADB added to A-Shell.